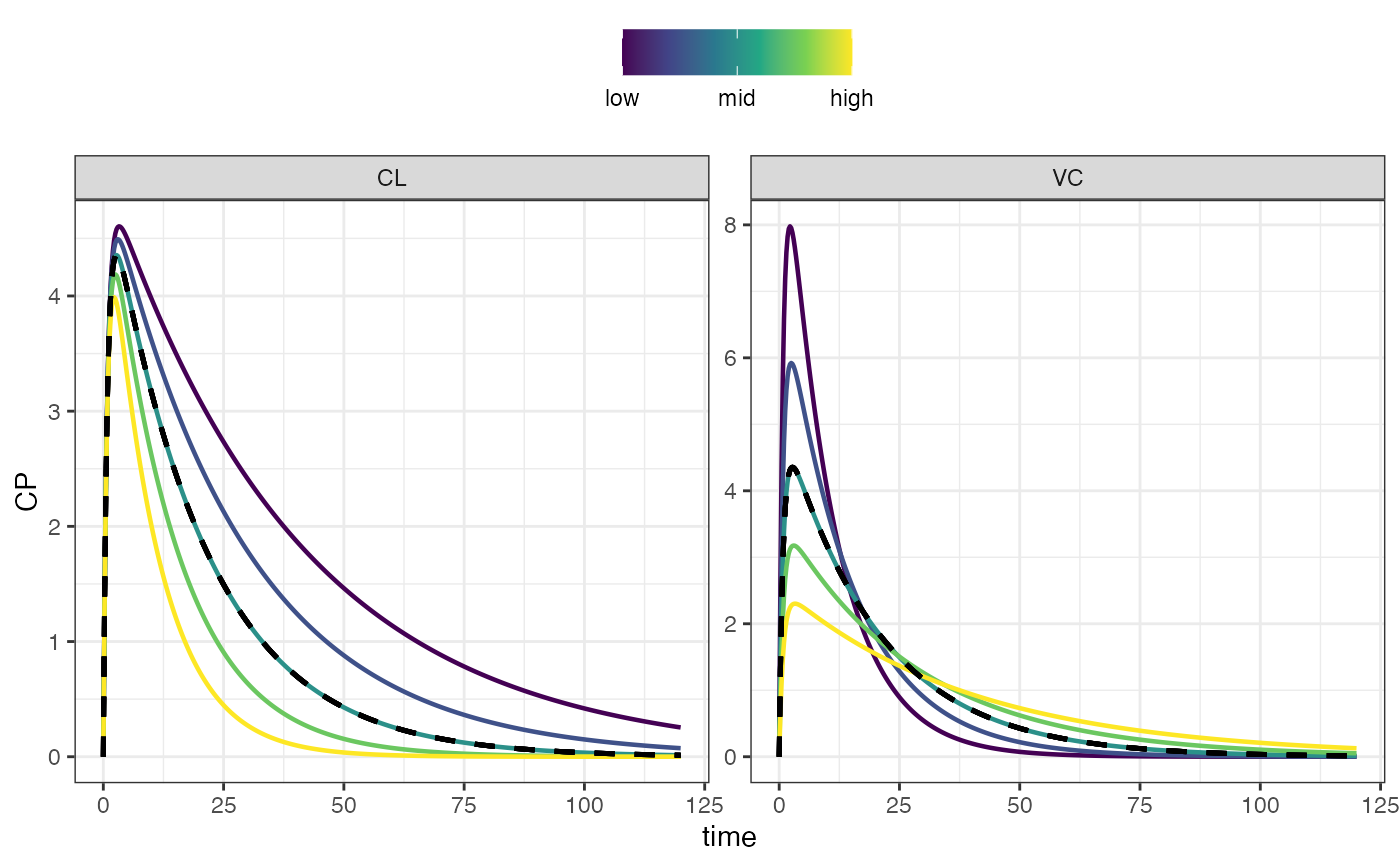
Plot sensitivity analysis results
Usage
sens_plot(data, ...)

# S3 method for sens_each
sens_plot(
  data,
  dv_name = NULL,
  p_name = NULL,
  logy = FALSE,
  ncol = NULL,
  lwd = 0.8,
  digits = 3,
  plot_ref = TRUE,
  xlab = "time",
  ylab = dv_name[1],
  layout = c("default", "facet_grid", "facet_wrap", "list"),
  grid = FALSE,
  ...
)

# S3 method for sens_grid
sens_plot(
  data,
  dv_name,
  digits = 2,
  ncol = NULL,
  lwd = 0.8,
  logy = FALSE,
  plot_ref = TRUE,
  ...
)
Arguments
- data
output from
sens_each()orsens_grid().- ...
arguments passed on to methods.
- dv_name
output columns name to plot; can be a comma-separated string.
- p_name
parameter names to plot; can be a comma-separates string.
- logy
if
TRUE, y-axis is transformed to log scale- ncol
passed to
ggplot2::facet_wrap().- lwd
passed to
ggplot2::geom_line().- digits
used to format numbers on the strips.
- plot_ref
if
TRUE, then the reference case will be plotted in a black dashed line.- xlab
x-axis title.
- ylab
y-axis title; not used for
facet_gridorfacet_wraplayouts.- layout
specifies how plots should be returned when
dv_namerequests multiple dependent variables; seeDetails.- grid
if
TRUE, plots from thesens_eachmethod will be arranged on a page withpatchwork::wrap_plots(); see thencolargument.
Details
The layout argument let's you get the plots back in different formats
when multiple dependent variables are requested via dv_name.
Use
defaultto get the plots back in a list if multiple dependent variables are requested otherwise a single plot is returned.Use
facet_gridto get a single plot, with parameters in columns and dependent variables in rows.Use
facet_wrapto get a plot with faceted usingggplot2::facet_wrap(), with both the parameter name and the dependent variable name in the strip.Use
listto force output to be a list of plots; this output can be further arranged usingpatchwork::wrap_plots()if desired.
When grid is TRUE, a list of plots will be returned when multiple
dependent variables are requested.